40 Probability & Statistics Data Science Interview Questions Asked By FAANG & Wall Street
We can't lie - Data Science Interviews are TOUGH. Especially tricky - probability and statistics questions asked by top tech companies & hedge funds during the Data Science, Data Analyst, and the Quant Trading Interview process.
That's why we put together 40 real probability & statistics data science interview questions asked by companies like Facebook, Amazon, Two Sigma, & Bloomberg. We have solutions to all 40 problems, and to 161 other data interview problems on SQL, Machine Learning, and Product/Business Sense in our book, Ace The Data Science Interview. You can also practice some of these same exact questions on DataLemur's statistics interview questions section.
So, without further ado, here are:
- the probability & stat concepts to review before your DS interview
- 20 probability questions asked by top tech-companies & Wall Street
- 20 statistics questions asked by FANG & Hedge Funds
- solutions to 5 of the probability questions
- solutions to 5 of the statistics questions
- links to more data science interview resources
Probability & Statistics Concepts To Review Before Your Data Science Interview
Because probability & statistics is foundational to the field of Data Science, before the interview you should review:
- Probability Basics & Random Variables
- Probability Distributions
- Hypothesis Testing
- Regression Analysis
In case these statistical concepts sound alien to you, check out some of our favorite Statistics Books for Data Analysts to get a gentle refresher.
Probability Basics and Random Variables
The beginnings of probability start with thinking about sample spaces, basic counting and combinatorial principles. Although it is not necessary to know all of the ins-and-outs of combinatorics, it is helpful to understand the basics for simplifying problems. One classic example here is the “stars and bars” counting method.
The other core topic to study is random variables. Knowing concepts related to expectation, variance, covariance, along with the basic probability distributions is crucial.
Probability Distributions
For modeling random variables, knowing the basics of various probability distributions is essential. Understanding both discrete and continuous examples, combined with expectations and variances, is crucial. The most common distributions discussed in interviews are the Uniform and Normal but there are plenty of other well-known distributions for particular use cases (Poisson, Binomial, Geometric).
Most of the time knowing the basics and their applications should suffice. For example, which distribution would flipping a coin be under? What about waiting for an event? It never hurts being able to do the derivations for expectation, variance, or other higher moments.
Hypothesis Testing
Hypothesis testing is the backbone behind statistical inference and can be broken down into a couple of topics. The first is the Central Limit Theorem, which plays an important role in studying large samples of data. Other core elements of hypothesis testing: sampling distributions, p-values, confidence intervals, type I and II errors. Lastly, it is worth looking at various tests involving proportions, and other hypothesis tests.
Most of these concepts play a crucial role in A/B testing, which is a commonly asked topic during interviews at consumer-tech companies like Facebook, Amazon, and Uber. It's useful to not only understand the technical details but also conceptually how A/B testing operates, what the assumptions are, possible pitfalls, and applications to real-life products.
Modeling
Modeling relies on a strong understanding of probability distributions and hypothesis testing. Since it is a broad term, we will refer to modeling as the areas which have a strong statistical intersection with Machine Learning. This includes topics such as: linear regression, maximum likelihood estimation, & bayesian statistics. For interviews focused on modeling and machine learning, knowing these topics is essential.
20 Probability Interview Problems Asked By Top-Tech Companies & Wall Street
- [Facebook - Easy] [Coin Fairness Test on DataLemur] There is a fair coin (one side heads, one side tails) and an unfair coin (both sides tails). You pick one at random, flip it 5 times, and observe that it comes up as tails all five times. What is the chance that you are flipping the unfair coin?
- [Lyft - Easy] You and your friend are playing a game. The two of you will continue to toss a coin until the sequence HH or TH shows up. If HH shows up first, you win. If TH shows up first, your friend wins. What is the probability of you winning?
- [Google - Easy] What is the probability that a seven-game series goes to 7 games?
- [Facebook - Easy] Facebook has a content team that labels pieces of content on the platform as spam or not spam. 90% of them are diligent raters and will label 20% of the content as spam and 80% as non-spam. The remaining 10% are non-diligent raters and will label 0% of the content as spam and 100% as non-spam. Assume the pieces of content are labeled independently from one another, for every rater. Given that a rater has labeled 4 pieces of content as good, what is the probability that they are a diligent rater?
- [Bloomberg - Easy] Say you draw a circle and choose two chords at random. What is the probability that those chords will intersect?
- [Amazon - Easy] 1/1000 people have a particular disease, and there is a test that is 98% correct if you have the disease. If you don’t have the disease, there is a 1% error rate. If someone tests positive, what are the odds they have the disease?
- [Facebook - Easy] There are 50 cards of 5 different colors. Each color has cards numbered between 1 to 10. You pick 2 cards at random. What is the probability that they are not of same color and also not of same number?
- [Tesla - Easy] A fair six-sided die is rolled twice. What is the probability of getting 1 on the first roll and not getting 6 on the second roll?
- [Facebook - Easy] What is the expected number of rolls needed to see all 6 sides of a fair die?
- [Microsoft - Easy] Three friends in Seattle each told you it’s rainy, and each person has a 1/3 probability of lying. What is the probability that Seattle is rainy? Assume the probability of rain on any given day in Seattle is 0.25.
- [Uber - Easy] Say you roll three dice, one by one. What is the probability that you obtain 3 numbers in a strictly increasing order?
- [Bloomberg - Medium] Three ants are sitting at the corners of an equilateral triangle. Each ant randomly picks a direction and starts moving along the edge of the triangle. What is the probability that none of the ants collide? Now, what if it is k ants on all k corners of an equilateral polygon?
- [Two Sigma - Medium] What is the expected number of coin flips needed to get two consecutive heads?
- [Amazon - Medium] How many cards would you expect to draw from a standard deck before seeing the first ace?
- [Robinhood - Medium] A and B are playing a game where A has n+1 coins, B has n coins, and they each flip all of their coins. What is the probability that A will have more heads than B?
- [Airbnb - Medium] Say you are given an unfair coin, with an unknown bias towards heads or tails. How can you generate fair odds using this coin?
- [Quora - Medium] Say you have N i.i.d. draws of a normal distribution with parameters μ and σ. What is the probability that k of those draws are larger than some value Y?
- [Spotify - Hard] A fair die is rolled n times. What is the probability that the largest number rolled is r, for each r in 1..6?
- [Snapchat - Hard] There are two groups of n users, A and B, and each user in A is friends with those in B and vice versa. Each user in A will randomly choose a user in B as their best friend and each user in B will randomly choose a user in A as their best friend. If two people have chosen each other, they are mutual best friends. What is the probability that there will be no mutual best friendships?
- [Tesla - Hard] Suppose there is a new vehicle launch upcoming. Initial data suggests that any given day there is either a malfunction with some part of the vehicle or possibility of a crash, with probability p which then requires a replacement. Additionally, each vehicle that has been around for n days must be replaced. What is the long-term frequency of vehicle replacements?
20 Statistics Problems Asked By FAANG & Hedge Funds
- [Facebook - Easy] How would you explain a confidence interval to a non-technical audience?
- [Two Sigma - Easy] Say you are running a multiple linear regression and believe there are several predictors that are correlated. How will the results of the regression be affected if they are indeed correlated? How would you deal with this problem?
- [Uber - Easy] Describe p-values in layman’s terms.
- [Facebook - Easy] How would you build and test a metric to compare two user’s ranked lists of movie/tv show preferences?
- [Microsoft - Easy] Explain the statistical background behind power.
- [Twitter - Easy] Describe A/B testing. What are some common pitfalls?
- [Google - Medium] How would you derive a confidence interval from a series of coin tosses?
- [Stripe - Medium] Say you model the lifetime for a set of customers using an exponential distribution with parameter λ, and you have the lifetime history (in months) of n customers. What is your best guess for λ?
- [Lyft - Medium] Derive the mean and variance of the uniform distribution U(a, b).
- [Google - Medium] Say we have X ~ Uniform(0, 1) and Y ~ Uniform(0, 1). What is the expected value of the minimum of X and Y?
- [Spotify - Medium] You sample from a uniform distribution [0, d] n times. What is your best estimate of d?
- [Quora - Medium] You are drawing from a normally distributed random variable X ~ N(0, 1) once a day. What is the approximate expected number of days until you get a value of more than 2?
- [Facebook - Medium] Derive the expectation for a geometric distributed random variable.
- [Google - Medium] A coin was flipped 1000 times, and 550 times it showed up heads. Do you think the coin is biased? Why or why not?
- [Robinhood - Medium] Say you have n integers 1…n and take a random permutation. For any integers i, j let a swap be defined as when the integer i is in the jth position, and vice versa. What is the expected value of the total number of swaps?
- [Uber - Hard] What is the difference between MLE and MAP? Describe it mathematically.
- [Google - Hard] Say you have two subsets of a dataset for which you know their means and standard deviations. How do you calculate the blended mean and standard deviation of the total dataset? Can you extend it to K subsets?
- [Lyft - Hard] How do you randomly sample a point uniformly from a circle with radius 1?
- [Two Sigma - Hard] Say you continually sample from some i.i.d. uniformly distributed (0, 1) random variables until the sum of the variables exceeds 1. How many times do you expect to sample?
- [Uber - Hard] Given a random Bernoulli trial generator, how do you return a value sampled from a normal distribution
Solutions To Probability Interview Questions
Problem #1 Solution:
We can use Bayes Theorem here. Let U denote the case where we are flipping the unfair coin and F denote the case where we are flipping a fair coin. Since the coin is chosen randomly, we know that P(U) = P(F) = 0.5. Let 5T denote the event where we flip 5 heads in a row. Then we are interested in solving for P(U|5T), i.e., the probability that we are flipping the unfair coin, given that we saw 5 tails in a row.
We know P(5T|U) = 1 since by definition the unfair coin will always result in tails. Additionally, we know that P(5T|F) = 1/2^5 = 1/32 by definition of a fair coin. By Bayes Theorem we have:
\[P(U|5T) = \frac{P(5T|U) * P(U)}{P(5T|U) * P(U) + P(5T|F) * P(F)} = \frac{0.5}{0.5 + 0.5 * 1/32} = 0.97\]
Therefore the probability we picked the unfair coin is about 97%.
Problem #5 Solution:
By definition, a chord is a line segment whereby the two endpoints lie on the circle. Therefore, two arbitrary chords can always be represented by any four points chosen on the circle. If you choose to represent the first chord by two of the four points then you have:
\[{4\choose2} = 6 \]
choices of choosing the two points to represent chord 1 (and hence the other two will represent chord 2). However, note that in this counting, we are duplicating the count of each chord twice since a chord with endpoints p1 and p2 is the same as a chord with endpoints p2 and p1. Therefore the proper number of valid chords is:
\[\frac{1}{2}{4\choose2} = 3\]
Among these three configurations, only exactly one of the chords will intersect, hence the desired probability is:
\[p = \frac{1}{3}\]
Problem #13 Solution:
Let X be the number of coin flips needed until two heads. Then we want to solve for E[X]. Let H denote a flip that resulted in heads, and T denote a flip that resulted in tails. Note that E[X] can be written in terms of E[X|H] and E[X|T], i.e. the expected number of flips needed, conditioned on a flip being either heads or tails respectively.
Conditioning on the first flip, we have:
\[E[X] = \frac{1}{2}(1+E[X|H]) + \frac{1}{2}(1+E[X|T])\]
Note that E[X|T] = E[X] since if a tail is flipped, we need to start over in getting two heads in a row.
To solve for E[X|H], we can condition it further on the next outcome: either heads (HH) or tails (HT).
Therefore, we have:
\[E[X|H] = \frac{1}{2}(1+E[X|HH]) + \frac{1}{2}(1+E[X|HT])\]
Note that if the result is HH, then E[X|HH] = 0 since the outcome was achieved, and that E[X|HT] = E[X] since a tail was flipped, we need to start over again, so:
\[E[X|H] = \frac{1}{2}(1+0) + \frac{1}{2}(1+E[X]) = 1 + \frac{1}{2}E[X]\]
Plugging this into the original equation yields E[X] = 6 coin flips
Problem #15 Solution:
Consider the first n coins that A flips, versus the n coins that B flips.
There are three possible scenarios:
- A has more heads than B
- A and B have an equal amount of heads
- A has less heads than B
Notice that in scenario 1, A will always win (irrespective of coin n+1), and in scenario 3, A will always lose (irrespective of coin n+1). By symmetry, these two scenarios have an equal probability of occurring.
Denote the probability of either scenario as x, and the probability of scenario 2 as y.
We know that 2x + y = 1 since these 3 scenarios are the only possible outcomes. Now let’s consider coin n+1. If the flip results in heads, with probability 0.5, then A will have won after scenario 2 (which happens with probability y). Therefore, A’s total chances of winning the game are increased by 0.5y.
Thus, the probability that A will win the game is:
\[x + \frac{1}{2}y = x + \frac{1}{2}(1-2x) = \frac{1}{2}\]
Problem #18 Solution:
Let B be the event that all n rolls have a value less than or equal to r. Then we have:
\[P(B_r) = \frac{r^n}{6^n}\]
since all n rolls must have a value less than or equal to r. Let A be the event that the largest number is r. We have:
\[B_r = B_{r-1} \cup A_r\]
and since the two events on the right hand side are disjoint, we have:
\[P(B_r) = P(B_{r-1}) + P(A_r)\]
Therefore, the probability of A is given by:
\[P(A_r) = P(B_{r}) - P(B_{r-1}) = \frac{r^n}{6^n} - \frac{(r-1)^n}{6^n}\]
Solutions To Statistics Interview Questions
Problem #2 Solution:
There will be two main problems. The first is that the coefficient estimates and signs will vary dramatically, depending on what particular variables you include in the model. In particular, certain coefficients may even have confidence intervals that include 0 (meaning it is difficult to tell whether an increase in that X value is associated with an increase or decrease in Y). The second is that the resulting p-values will be misleading - an important variable might have a high p-value and deemed insignificant even though it is actually important.
You can deal with this problem by either removing or combining the correlated predictors. In removing the predictors, it is best to understand the causes of the correlation (i.e. did you include extraneous predictors or such as both X and 2X). For combining predictors, it is possible to include interaction terms (the product of the two). Lastly, you should also 1) center data, and 2) try to obtain a larger sample size (which will lead to narrower confidence intervals).
p.s. try this interactive Python coding interview question about computing the Pearson Correlation Coefficient
Problem #9 Solution:
For X ~U(a, b) we have the following:
\[f_X(x) = \frac{1}{b-a}\]
Therefore we can calculate the mean as:
\[E[X] = \int_{a}^{b}xf_X(x)dx = \int_{a}^{b}\frac{x}{b-a}dx = \frac{x^2}{2(b-a)} \Big|_a^b = \frac{a+b}{2}\]
Similarly for variance we want:
\[Var(X) = E[X^2] - E[X]^2\]
And we have:
\[E[X^2] = \int_{a}^{b}x^2f_X(x)dx = \int_{a}^{b}\frac{x^2}{b-a}dx = \frac{x^3}{3(b-a)} \Big|_a^b = \frac{a^2+ab+b^2}{3}\]
Therefore:
\[Var(X) = \frac{a^2+ab+b^2}{3} - (\frac{a+b}{2})^2 = \frac{(b-a)^2}{12}\]
Problem #12 Solution:
Since X is normally distributed, we can look at the cumulative distribution function (CDF) of the normal distribution:
\[\Phi(x) = P(X \le x) \]
To check the probability X is at least 2, we can check (knowing that X is distributed as standard normal):
\[\Phi(2) = P(X \le 2) = P(X \le \mu + 2\sigma) = 0.977 \]
Therefore P(X > 2) = 1 - 0.977 = 0.023 for any given day. Since the draws are independent each day, then the expected time until drawing an X > 2 follows a geometric distribution, with p = 0.023. Let T be a random variable denoting the number of days, then we have:
\[E[T] = \frac{1}{p} = \frac{1}{.024} \approx 43 \space \text{days}\]
Problem #14 Solution:
Because the sample size of flips is large (1000), we can apply the Central Limit Theorem. Since each individual flip is a Bernoulli random variable, we can assume it has a probability of showing up heads as p. Then we want to test whether p is 0.5 (i.e. whether it is fair). The Central Limit Theorem allows us to approximate the total number of heads seen as being normally distributed.
More specifically, the number of heads seen should follow a Binomial distribution since it a sum of Bernoulli random variables. If the coin is not biased (p = 0.5), then we have the following on the expected number of heads:
\[\mu = np = 1000*0.5 = 500\]
and the variance is given by:
\[\sigma^2 = np(1-p) = 1000*0.5*0.5 = 250, \sigma = \sqrt{250} \approx 16\]
Since this mean and standard deviation specify the normal distribution, we can calculate the corresponding z-score for 550 heads:
\[z = \frac{550-500}{16} > 3\]
This means that, if the coin were fair, the event of seeing 550 heads should occur with a < 1% chance under normality assumptions. Therefore, the coin is likely biased.
Problem #20 Solution:
Assume we have n Bernoulli trials each with a success probability of p:
\[x_1, x_2, ... x_n, \space x_i \sim Ber(p)\]
Assuming iid trials, we can compute the sample mean for p from a large number of trials:
\[\hat{\mu} = \frac{1}{n}\sum_{i=1}^{n}x_i\]
We know the expectation of this sample mean is:
\[E[\hat{\mu}] = \frac{np}{n} = p\]
Additionally, we can compute the variance of this sample mean:
\[Var(\hat{\mu}) = \frac{np(1-p)}{n^2} = \frac{p(1-p)}{n}\]
Assume we sample a large n. Due to the Central Limit Theorem, our sample mean will be normally distributed:
\[\hat{\mu} \sim N(p, \frac{p(1-p)}{n})\]
Therefore we can take a z-score of our sampled mean as:
\[z(\hat{\mu}) = \frac{\hat{\mu} - p}{\sqrt{\frac{p(1-p)}{n}}}\]
This z-score will then be a simulated value from a standard normal distribution.
How To Get More Data Science Interview Prep Resources
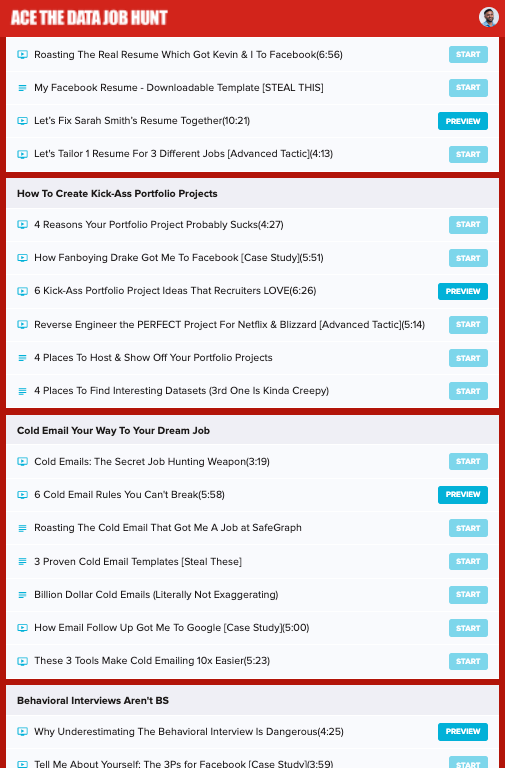
Make sure to buy the full 301-page book on Amazon and also enroll in the video course, Ace the Data Job Hunt, which covers the resume, portfolio project, cold email networking, and behavioral interview aspects of landing your dream job in data!
You'll probably also love the 30 SQL & Database questions we put together. While not as difficult as the stat/prob questions here, having a strong grasp of SQL and database design is crucial for any practicing Data Scientist or Data Analyst. And if you need less practice questions, and more general advice on how to prep for SQL interviews, check out my 5,000-word SQL interview prep guide.

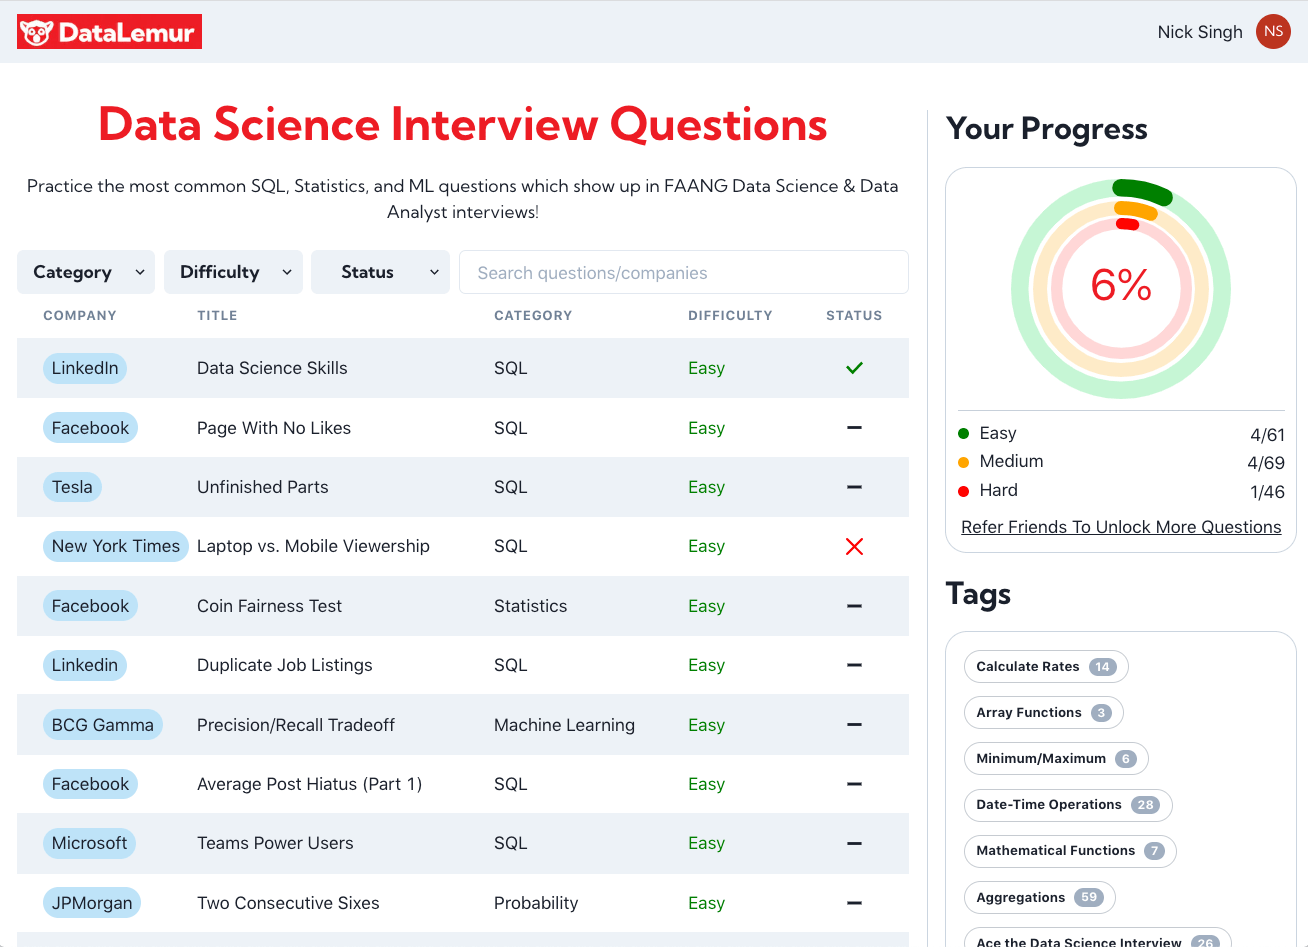
And because practice makes perfect, solve real FAANG SQL Interview questions on DataLemur. For example, below is a screenshot of an Amazon SQL Interview Question on the platform!
